Every account has worse months. Clients rarely leave because of one; they leave when a bad month arrives as a surprise, wrapped in percentages, with no explanation and no plan. Here is how to report a worse month so it builds trust instead of costing it.
Say it first
Put the bad news in the first sentence of the report, in plain words: "Messages cost 45% more in September than in August." A client who finds the problem on page three assumes you hoped they wouldn't. A client who reads it in the first line knows you're on top of it.
Check that it's real
Before explaining a drop, make sure it isn't produced by the comparison itself:
- A partial day or partial period. A period that includes today, or that is shorter than the one it's compared with, looks worse automatically.
- Results still coming in. The newest days are still collecting results credited to earlier clicks and views, so a period that ended yesterday is not finished yet.
- Too few results. 6 purchases against 9 is a 33% drop that may be pure chance.
- A change in tracking. If results fell but the client's sales or conversations didn't, check the tracking before blaming the ads.
Find the cause
Most worse months come from a short list of causes, and the data usually points at one of them.
- The same people saw the ads too often. Rising frequency together with falling results or a rising cost per result is a sign of ad fatigue; Meta's advice is to refresh the creative or change the targeting (Meta).
- The ads stopped catching attention. A falling click-through rate, often in the same ads whose frequency rose.
- Something was edited. Pausing an ad set or changing its optimization event, audience or creative can restart the learning phase, and so can a large budget or bid change (Meta). Results are usually less stable while an ad set is learning (Meta).
- Attention got more expensive. A higher CPM means each 1,000 impressions cost more, even if the ads themselves didn't change.
- Demand moved. Seasons, prices, stock and competitors change what the same ads can produce.

Show the evidence, not just the drop
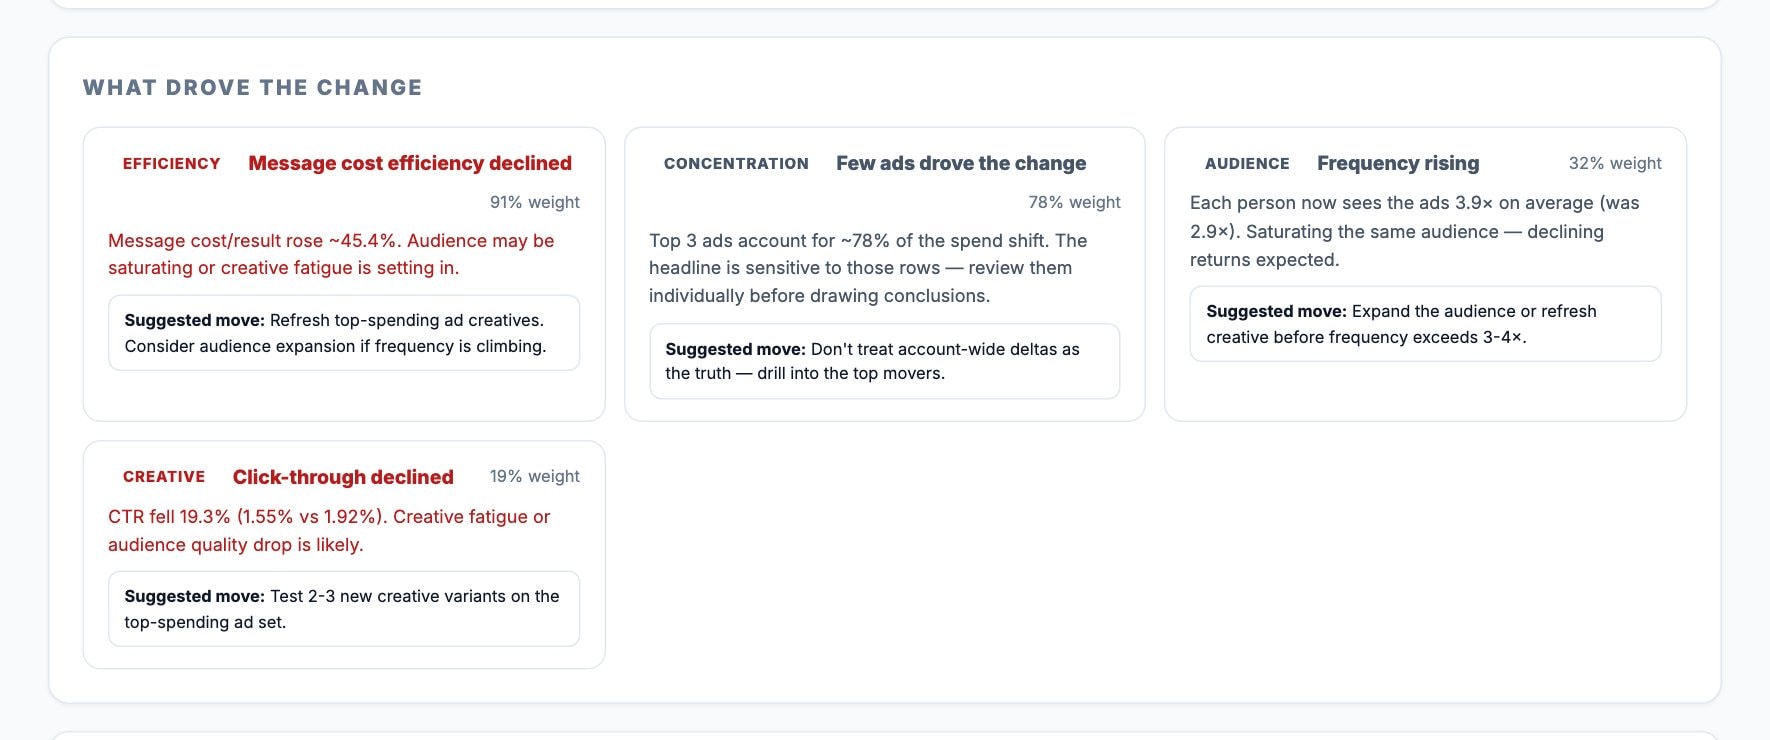
Point to the numbers that show the cause, so the explanation can be checked. In the example below, the cost per message rose, frequency climbed and the click-through rate fell, all in the ads that spent the most: a textbook case of tired creative.
Say what you'll do, and when you'll know
End with the plan and a date for judging it. If you change the creative or the audience, the ad set may go back into learning, and Meta suggests waiting for about 50 optimization events after a significant edit before reading its costs as stable (Meta). Tell the client that, so the first days after a change aren't judged as the new normal.
A message you can adapt
What not to do
- Don't switch to a different metric to find a better number. Report the goal you agreed on.
- Don't blame Meta or "the algorithm" without evidence. If you can't find the cause yet, say so and say what you are checking.
- Don't hide a drop behind a percentage of a percentage. Use the actual numbers.
- Don't promise a date for the recovery. Promise a date for the next check.
How Adams Analytics helps
On every plan, an Adams Analytics comparison states what happened in plain words, says how confident it is, and lists what drove the change with a suggested next step for each, in English or Arabic. That gives you the first draft of the explanation above. See how it works.
Questions
Should I mention a bad month before the client asks?
Yes, and in the first line of the report. Clients forgive a worse month far more easily than a surprise.
How do I know a drop is real and not noise?
Check that both periods are complete and the same length, that recent days have had time to collect their results, and that each period has enough results; a handful either way can be chance.
What are the most common causes of a worse month?
Ad fatigue (frequency up, clicks down), edits that restarted the learning phase, more expensive attention (higher CPM), and changes in demand such as seasons, prices or stock.
How long should I wait before judging a fix?
If the change restarted learning, Meta suggests waiting for about 50 optimization events after the significant edit before treating costs as stable.
What should I avoid when reporting bad results?
Switching metrics to find a good number, blaming the platform without evidence, hiding drops behind percentages, and promising a recovery date.
Sources
Send your next client report in minutes
Adams Analytics connects to your Meta ad accounts and builds branded PDF reports in English or Arabic. Free for 7 days — no credit card.
Start free trialWritten by the Adams Analytics team and checked against Meta’s documentation and our own product. Spotted something out of date? Tell us at support@buildincairo.com.